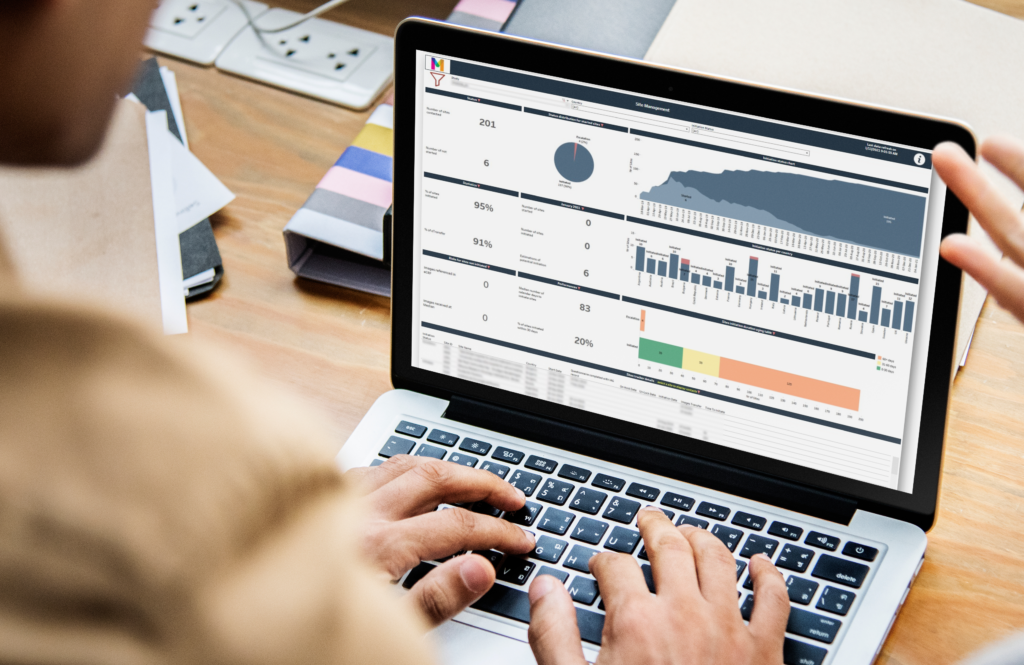
Business Intelligence-based reporting optimizes the operational efficiency of clinical trial imaging services
Business Intelligence (BI) is the combination of business analytics, data mining, data visualization, data tools and infrastructure, and best practices, which together can transform data into actionable insights that inform an organization’s business decisions .
As an imaging CRO, Median uses Business Intelligence tools to streamline operations and provide a superior level of project management service. We use the power of BI to provide customized data visualization dashboards to support our main project activities and customer objectives.
From overall project status to advanced monitoring of detailed activities, BI enables Median and our customers to make good decisions with optimal timing, managing risks and changes while increasing the trust of our biopharma customers through a high level of operational data transparency.
Optimizing operational efficiency covers the whole process of managing medical images in clinical studies, and includes all the data generated during a study, from data related to site initiation to those created during independent radiologic reads, through all the data produced during image QC and open query processes.
Download our case study about imaging workflow automation at Median
Imaging data in clinical trials: overcoming inherent complexity and continuously changing data sets
When considering data coming from an end-to-end clinical trial workflow, there are several specific challenges to implementing BI tools:
- The data come from multiple processes and sources: site management, image collection, queries, read management, etc;
- The data come from multiple systems that differ from one sponsor to another: internal DB (image QC systems and review systems), eCRF sponsor extracts, IWRS sponsor extracts, CTMS sponsor extracts; and
- There is a huge amount of data, which are continuously growing and changing.
Data integration and visualization: a must have, both internally for Median project management and externally for our clients
Considering the inherent complexity, diversity and continuously changing nature of clinical trial imaging data, data integration is complex and time consuming, but also has strong benefits, producing valuable internal reports that support a key goal we share with our biopharma customers: quality and quality faster!
The benefits are concrete, for instance, for identifying and fixing issues as they occur, monitoring operational data quality, providing accurate information to project managers easily and in quasi real-time, and easing the process of data cleaning. Finally, this can reduce the time to submit images to readers, the risk of reader rework due to late reconciliations and the time to prepare data transfers.
Data visualization tools ultimately optimize operational efficiency when used to deliver powerful reports, which provide insights into quality monitoring, activity, forecasts, and risk management. They also greatly assist quicker operational decision making and are key in reducing time to delivery. Most parts of the reports are made available to our biopharma sponsors through our platform, which provides clients with a huge level of transparency.
Creating value from data: our BI team and internal expertise
To exploit the promise of Business Intelligence tools and adapt them to our specific context, Median has developed its internal expertise and setup a group of data engineers and process experts. Our BI tools are based on the Tableau® BI platform, and because one size doesn’t fit all, we have the internal capabilities to customize a set of services and tools to meet our customers’ needs.
The Median BI team has the capabilities to perform in-depth analysis of the clinical trial design process, before building an appropriate data model and designing the data marts. The team has the expertise to define and build data cleaning and data integration tasks to implement the extraction, transformation (cleaning/integration) and loading of the ETL component, and finally to compile the data visualization reports.

Designing specific dashboard and visualization tools for our customers is an important component of our service offering, as part of the value creation chain, and is a key topic included in our client quotation process.
To know more about our BI-based reporting capabilities and how Median creates more value from your imaging data, watch our webinar replay
